Getting a Clearer View into Student Progress on the 2025 IAR
The latest Illinois Assessment of Readiness (IAR) results come at an important moment for how we understand student performance in Illinois. This year, the state updated its proficiency benchmarks, known as “cut scores,” which determine whether a student is considered to be meeting grade-level expectations. These changes were designed to better align Illinois’ assessments with college and career readiness and to bring greater consistency across subjects and grade levels.
Because those benchmarks changed, reported proficiency rates cannot be directly compared to prior years. As a result, looking only at the share of students meeting proficiency can give an incomplete picture of student performance over time. In this context, underlying scale scores – which reflect student performance on the assessment itself and are not affected by changes in “cut scores” – provide an especially important view of how students are performing in English language arts and mathematics.
To better understand student progress, we looked at both underlying scale scores and proficiency trends using a consistent benchmark across years. Scale scores offer a stable measure of performance regardless of where proficiency thresholds are set, and we applied the 2025 cut scores retroactively to prior years of data to enable accurate comparisons of proficiency over time.¹ Together, these approaches allow for a clearer and more accurate understanding of student learning trends over time.
Signs of Continued Academic Recovery
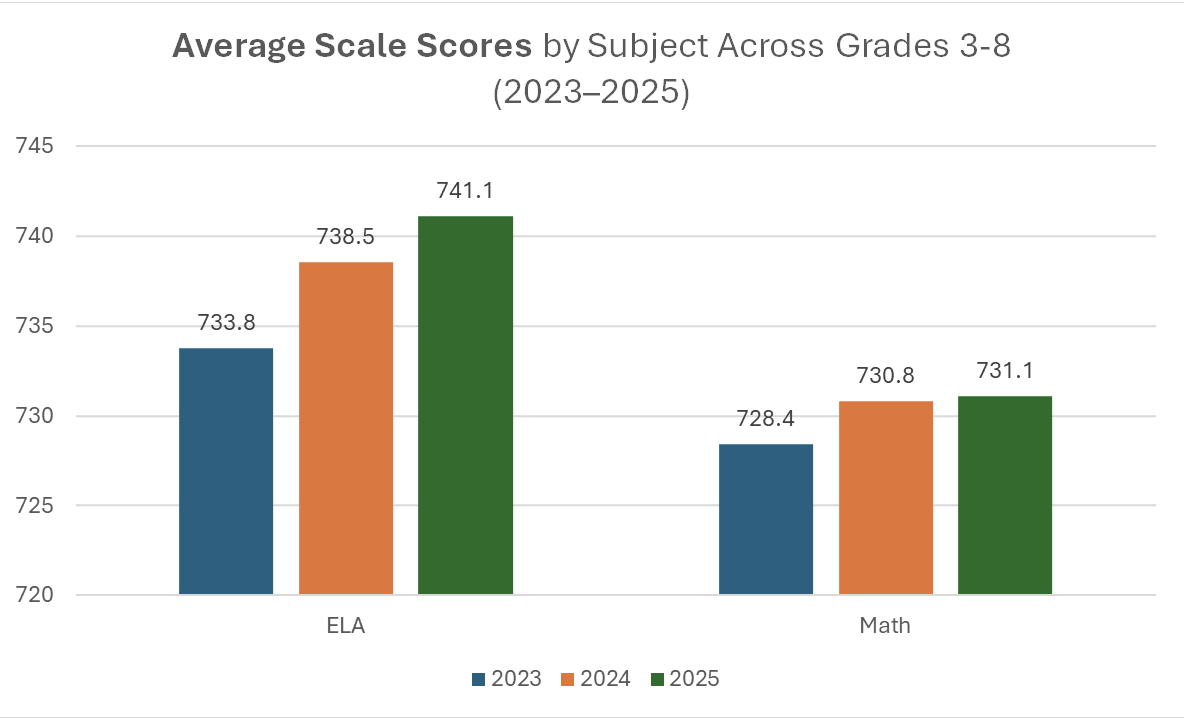
Looking at the underlying scale scores, Illinois students are showing steady improvement across grade levels in both ELA and math.
In ELA, average scores increased across all tested grades between 2023 and 2025. To illustrate how this trend appears across the grade band, we can look at both the lower and upper ends: Grade 3 scores rose from 723.9 in 2023 to 731.2 in 2025, while Grade 8 scores increased from 738.8 to 748.8 over the same period. Similar upward trends are also seen across the intermediate grades, and the figure below shows that this broader pattern is visible when results are viewed in the aggregate across grades 3 through 8, as overall scale scores increased from 733.8 in 2023 to 741.1 in 2025
In math, growth has been more modest. Although math scale scores increased overall from 728.4 in 2023 to 731.1 in 2025, growth by grade has been more uneven. For example, grade 3 average scores remained largely flat, increasing only slightly from 732.2 in 2023 to 732.6 in 2025, while Grade 8 scores rose from 724.2 to 729.1. Overall, math gains are present but smaller and less consistent than those observed in ELA, with somewhat stronger improvement at the higher grade levels.
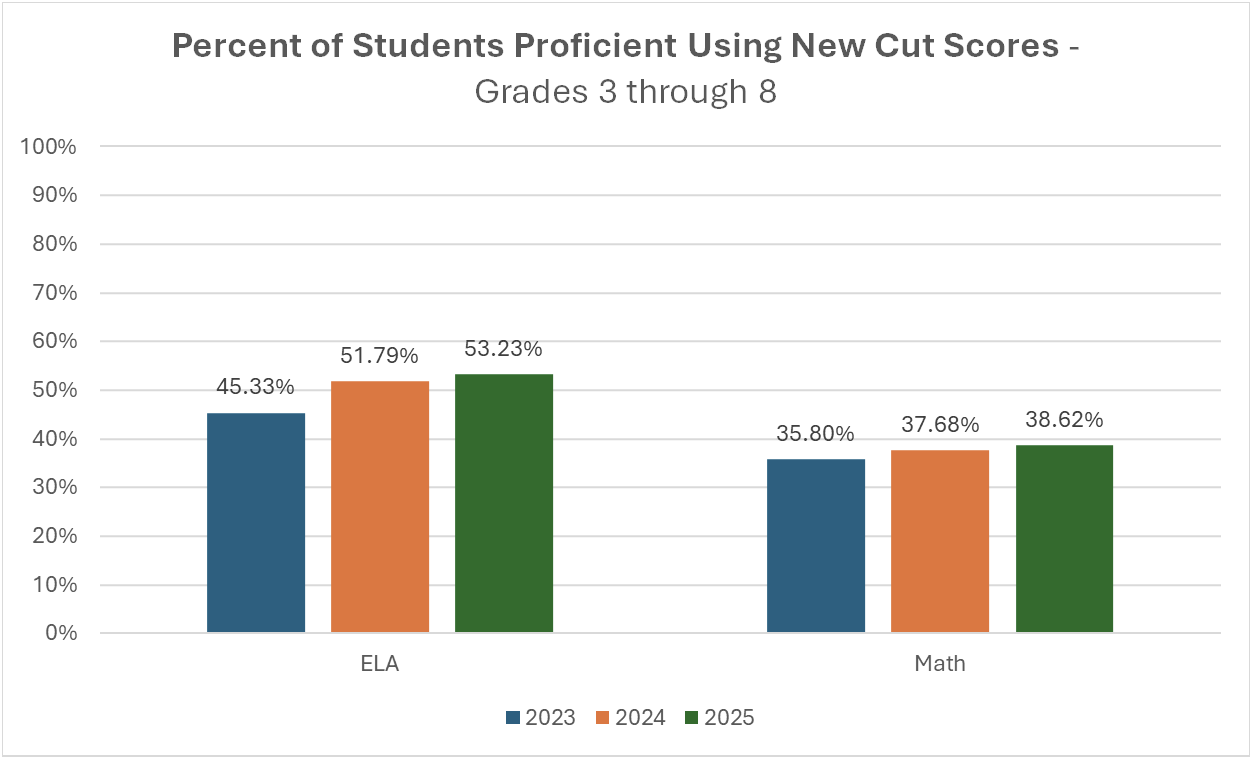
Proficiency trends, when applying the updated 2025 cut scores retroactively, reinforce this pattern of recovery. In ELA, the share of students meeting proficiency increased from 45.3 percent in 2023 to 53.2 percent in 2025 across grades 3 through 8. In math, proficiency rose from 35.8 percent to 38.6 percent over the same period. These trends indicate continued academic recovery following the disruptions of the pandemic, with stronger and more consistent gains in ELA than in math.
Persistent Gaps, but Consistent Progress Across Student Groups
While significant disparities in outcomes remain, it is important to recognize that progress is being made across all student groups.
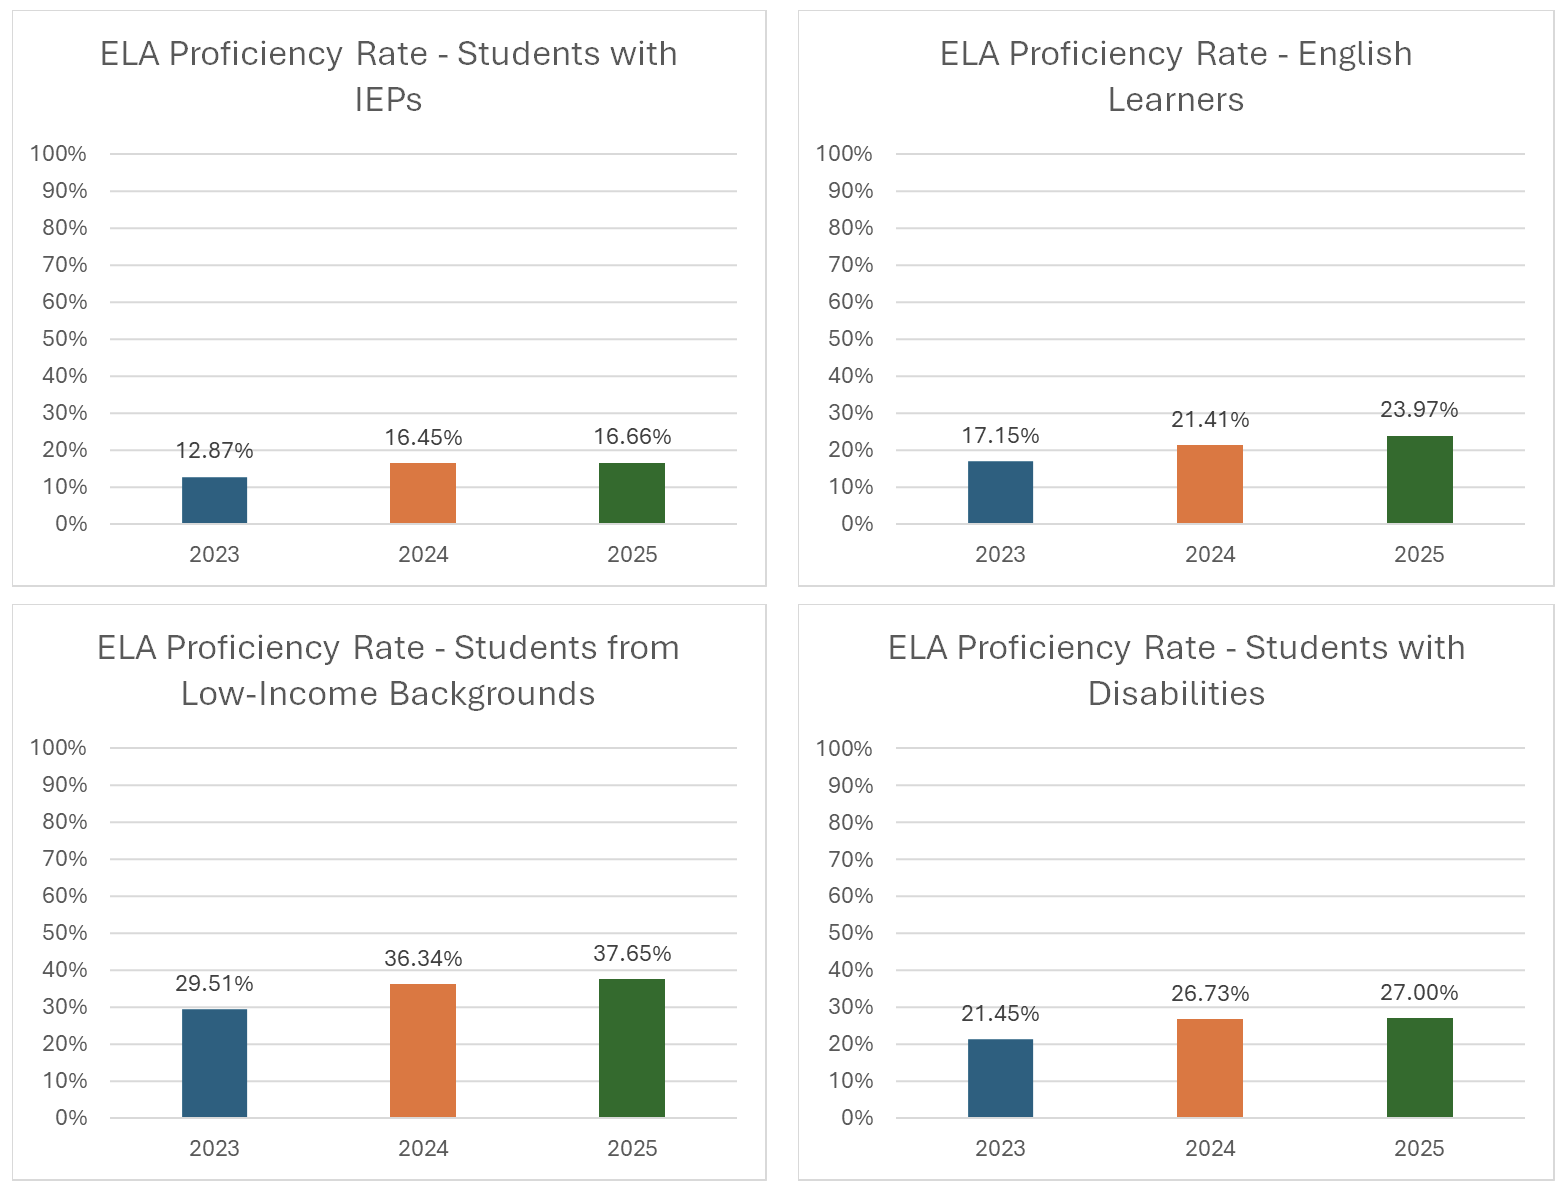
Across both ELA and math, nearly every student demographic group saw improvement between 2023 and 2025. As shown in the figures below, these gains are evident across racial and ethnic groups, as well as key student populations, including students with disabilities, English Learners, and students from low-income backgrounds.
While the magnitude of the improvement varies, the overall pattern is clear: progress is occurring broadly across the state rather than being concentrated among a single group. In ELA, gains have been particularly notable across historically underserved student populations, though performance levels remain substantially lower than statewide averages. Math outcomes follow a similar pattern, with modest improvements across groups but lower overall levels of proficiency.
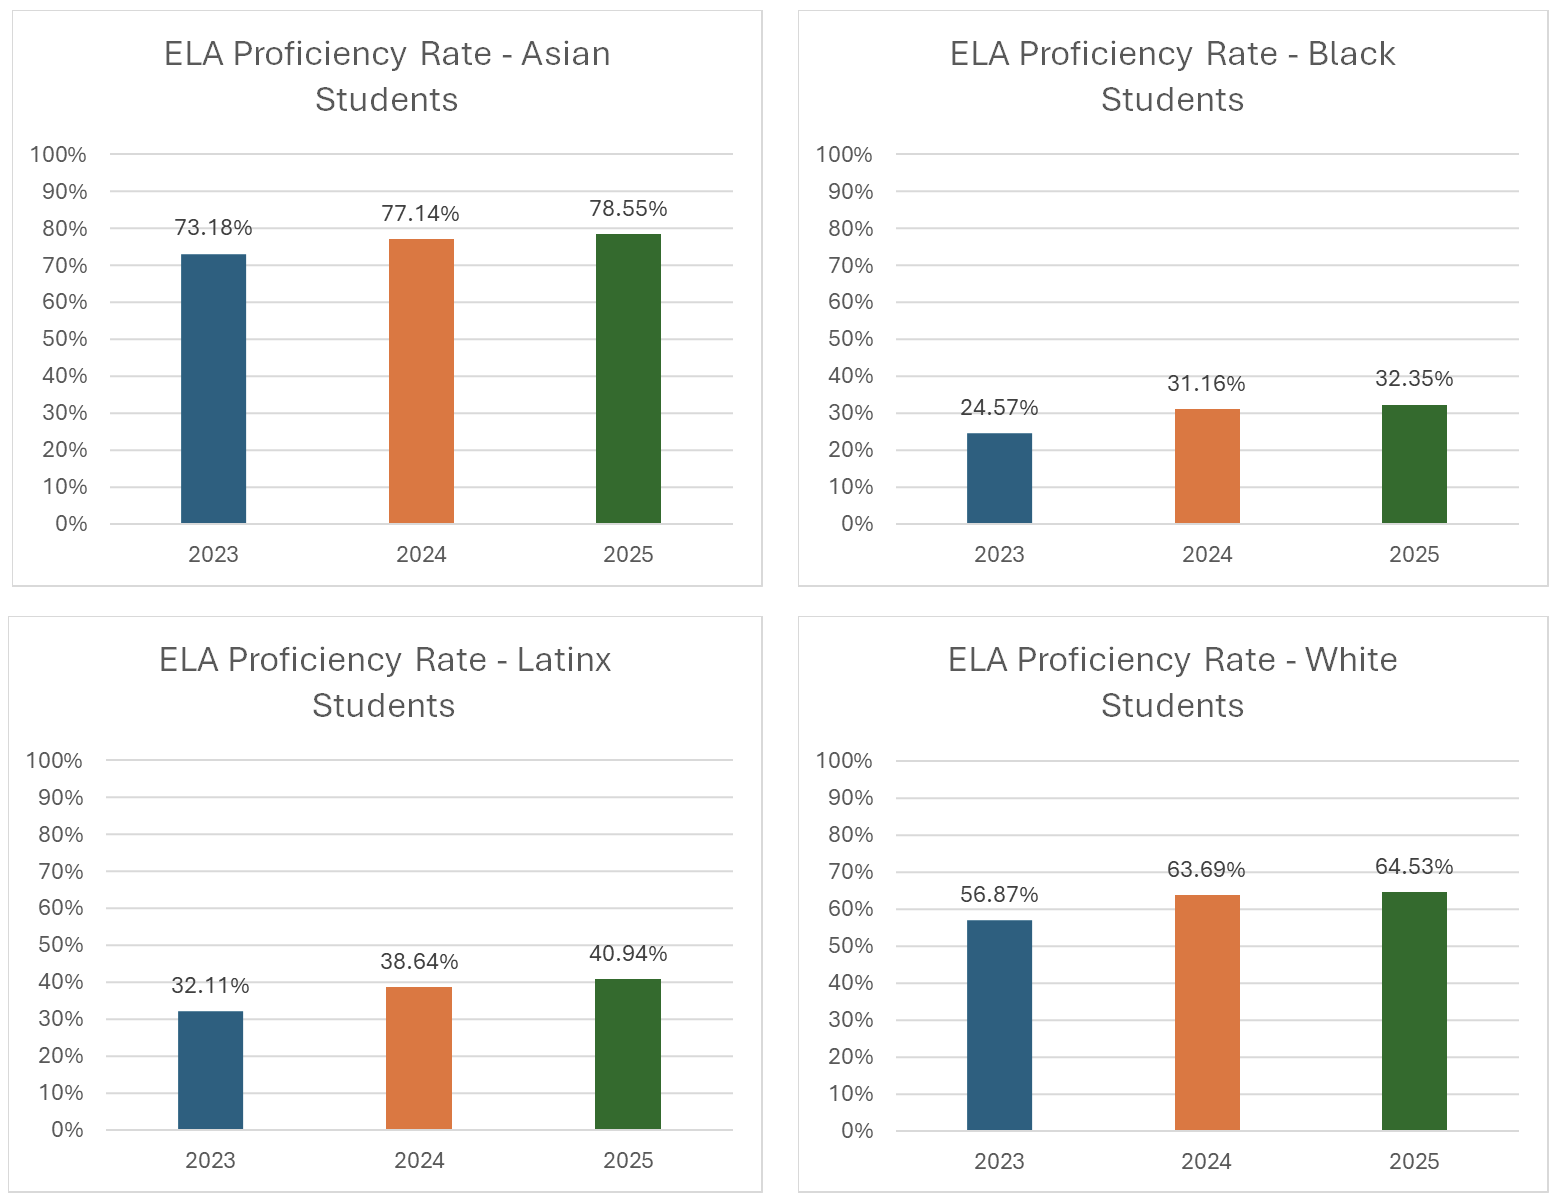
At the same time, these gains are occurring alongside persistent and substantial gaps. In 2025, students from historically underserved groups continue to have proficiency rates well below those of their peers across both subjects. While Asian and White students meet proficiency at much higher levels, Black and Latinx students, as well as students with IEPs, English Learners, and students from low-income backgrounds, remain significantly below statewide averages. These disparities are also reflected in scale scores, where, despite overall improvement, these groups remain consistently below statewide averages.
Taken together, the data tell a clear story: Illinois is seeing broad-based academic improvement, but is not yet achieving equitable outcomes. While it is encouraging that all student groups are improving, the persistence of sizable gaps underscores the need to ensure that continued progress translates into more equitable outcomes.
Important Context on Interpreting Results
As noted above, Illinois updated its proficiency cut scores in 2025, lowering the threshold for ELA and math for the IAR, while raising the threshold for science. Because of these changes, this year’s reported proficiency rates cannot be directly compared to those published in prior years. For that reason, this analysis relies on both underlying scale scores and retroactively adjusted proficiency trends to assess student progress over time. When looking at the trends holistically, they point to continued academic recovery while also showing that recovery remains incomplete across the state.
In Conclusion
At a moment when school districts, communities, educators, families, and students continue to navigate ongoing challenges and begin planning for the next school year, we want to recognize the real academic progress reflected in this year’s IAR results. Students across the state are showing signs of recovery, and importantly, gains are occurring across every student group.
At the same time, the data make clear that significant work remains. Persistent gaps in outcomes across race, income, and student subgroups continue to define the state’s education landscape. These results underscore just how far Illinois has come but also how much further we still need to go to ensure every student has access to the support and opportunities they need to succeed.
Jeffery Jen is a Senior Policy Associate for Advance Illinois.
¹ While the release of this year’s scores came later than usual, we now have access to these results, which are critical for understanding where students are making progress and where challenges remain.